|
The Directory of Trade Statistics compiled annually by the International Monetary Fund and the World Investment Report issued by the United Nations provide excellent documentation on the various flows of direct foreign investment. Direct Foreign Investment in the 70s
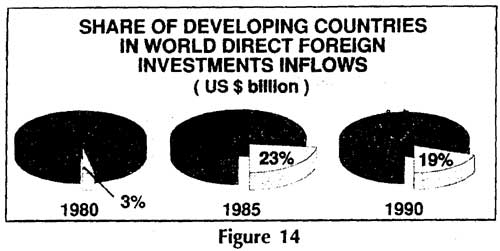
Furthermore, it is clear from the fact that domestic investment in developing economies is greater than Direct Foreign Investment, making the first form of investment a more important element in the domestic economy. Direct Foreign Investment in the 80s Though worldwide Direct Foreign Investment outflows registered I Compound annual growth rate of 28.9 per cent during 1983-89, reaching a level of US$196 billion inflows and US$1.5 trillion in Bdtsin 1989, out of the US$196 billion only US$30 billion went developing countries. Despite a growth of 23 per cent since 1985, compared to 3 per cent during 1980-84, the share of developing countries in worldwide inflows fell from 25 per cent 1960-84 to 19 per cent in the 1985-90 period. IIMF and OECD (Organisation for Economic Cooperation and orpiment) data show that a certain diversification has taken in both the origins and destinations of direct foreign flows. Over 95 per cent of recorded flows continue to originate in the OECD area and about three-quarters of the flows are channeled to other OECD countries.
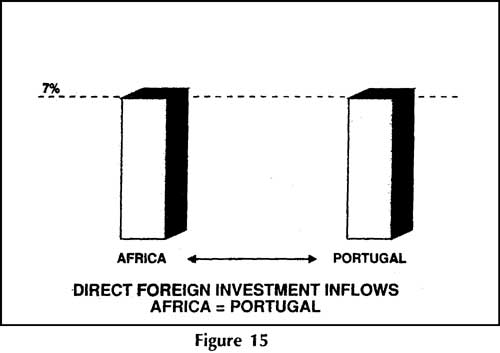
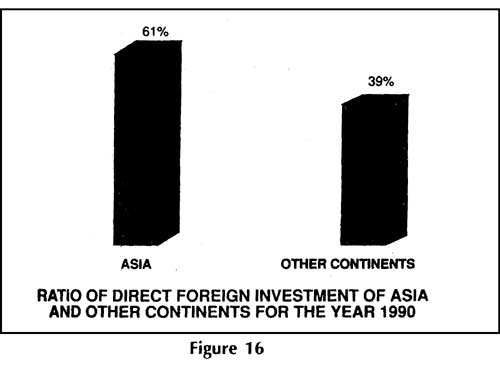
Africa received only 7 per cent - US$2.2 billion, roughly equal to that of a small country like Portugal- of all investment flows to developing countries in 1990. The figure was a 50 per cent drop from the exceptionally high levels of 1989, with most of the decline attributable to reduced flows to Nigeria and Egypt. Non-oil-exporting African countries, most of them least developed, received on an average less than US$0.5 billion annually during the second half of the 1980s - about the same as what Papua New Guinea a small country in the Pacific, attracted. Asia, which outstripped Latin America in 1986 in terms of inflow of investment capital, continued in 1990 to attract the lion's share, of developing country Direct Foreign Investment - about 61 per cent. The Asian region also continued to be an exporter of capital with an outflow of just under US$8 billion. On an average, outflows from Asia grew by 47 per cent yearly during the 1980s and 75 per cent during 1986-1990.
With the economies of the Asian tigers, especially South Koria and Taiwan booming, they too have become net exporters Direct Foreign Investment. This has happened due to appreciation of their currencies, removal of restrictions on outward capital flow the threat of protectionism from their major developed trading partners and their loss of status as developing countries which entitled them to preferential treatment in trade.
China also is now an investor of DFI abroad, having invested US$380
million in 1990. The Triad comprises North America (United States and Canada) Japan and the European Community. Both inflows and outflows of Direct Foreign Investment vest largely within the countries of the Triad and about 70 per cent of the world's inflows and over percent of the world's outflows have been within the Triad region itself and have been increasing within the region. Each member the Triad group is increasing its ties with certain select groups countries, close to where it is located, and- this trend is likely to continue. For example, Japan is strengthening its ties with countries in the ASEAN region, the European Community is likely to increase its strength in Europe, especially with the East European countries, "and the USA has a stronger connection with all of North America and possibly with some countries of Latin America in the future. Within the Triad Group, the United States, the United Kingdom, Japan, Germany and France were again the major sources of outflow and inflow of DFI in the 80s.
As stated earlier, in the latter part of the 80s, Japan, France, Germany and Canada emerged as the major countries of Direct Foreign Investment outflows, with Japan registering the largest outflows in the late 80s. Thus, with the formation of regional trade blocs, groups of countries are strengthening ties within these trading blocs and with neighbouring countries and with other countries with which they have been historically linked. This trend is likely to be further accelerated in the 90s. In the 80s, as in the previous decade, Direct Foreign Investment inflows to the developing countries was again concentrated in few countries, the major portion going to Brazil - 12 per cent Singapore - 12 per cent, Mexico - 11 per cent, China -10 per cent. Hong Kong - 7 per cent, Egypt - 6 per cent, Malaysia - 6 per cent, Argentina - 4 per cent, Thailand and Sri Lanka- 2 per cent each. There has also been an increasing trend of outflow of DFI from developing countries as they strive to industrialise and export and import technology and management skills. The major exporters of DFI from the developing world have been Brazil, Malaysia, Singapore and Hong Kong. Tables 19.1 and 19.2 show the global pattern of direct foreign investments, both outflows and inflows, from 1975 to 1991. Decline in the rate of growth of DFI Information technology has rendered the scope of activities of global corporations more effective, quite often without the actual flow of investment. Direct Foreign Investment and Development According to the "World Investment Report 1992: Transnational Corporations as Engines of Growth" issued by the United Nations, transnational corporations account for a substantial part of the assets, employment and trade in selected industries of many host countries, though Direct Foreign Investment as a proportion of gross domestic capital formation is under 10 per cent in most cases.
The number of such companies, which had never before been estimated, exceeded 35,000 by 1990 with more than 150,000 foreign affiliates. The world stock of Direct Foreign Investment now stands at US$1.7 trillion, with flows in 1990 amounting to US$225 billion. For many developing countries DFI (virtually all of which is generated by TNCs), has become the principal source of foreign capital, representing 74 per cent of total long term capital inflows from private sources of over 90 developing countries between 1986 and 1990. The other trends highlighted by the report are : Global corporations outspend major governments in the R & D of technologies; the combined R & D expenditure of the 10 largest global corporations exceed those of the French and British governments put together. Global corporations are increasing their involvement in some developing countries, particularly in Asia and Latin America, but those nations share in world flows is declining and the distribution among them is highly uneven. Central and Eastern Europe, as well as countries belonging to the former USSR, are likely to become more important as a host region for DFI, and the report predicts that cumulative investment flows to the region could exceed US$50 billion by the end of the decade. Though developing countries have benefited from the growth in overall DFI flows, receiving US$32 billion in 1990, their current share at 17 per cent of total inflows is less than it was 10 years ago. While most developing countries do not receive as much as they need to help stimulate development, what they do receive from global corporations is highly important and likely to become even more crucial to the growth of these countries. DFI in the services sector has been quite significant, with 40-50 per cent of annual flows being in the field of services.
Table
19.1 : DIRECT FOREIGN INVESTMENT INFLOWS
Table 19.2 : DIRECT FOREIGN INVESTMENT OUTFLOWS |